Are You Monitoring the Critical Parameters of the VHP Disinfection Process Correctly?
Date:2019/7/16
Understanding Critical MeasurementParameters in Vaporized Hydrogen Peroxide Bio-decontamination
The Relationships betweenTemperature, Relative Humidity and Relative Saturation
Because vaporized hydrogenperoxide leaves no residue and is efficient for bio-decontamination in roomtemperature, it is used widely in applications such as isolators, transferhatches and in different facilities that require reliable decontamination.
Effective killing ofmicroorganisms can be achieved with different humidity and H2O2 ppm levels. Some manufacturers ofbio-decontamination chambers or isolators prefer subvisiblecondensation, whereas others prefer dry bio-decontamination processes wherehumidity is maintained far from condensation. However, dripping condensationshould be avoided due to potentially negative effects on aeration time,materials and uniform decontamination efficiency. Therefore, it’s crucial tomeasure humidity during vaporized hydrogen peroxide bio-decontamination cycles.However, water (H2O) and hydrogen peroxide (H2O2) have a very similar molecularstructure. Therefore they both affect the humidity of the air.
Relative humidity by itsdefinition indicates the humidity of the air caused only by water vapor.
Therefore, humidity sensors used in vaporized hydrogenperoxide applications typically use a catalytic layer over a normal humiditysensor. The catalytic layer catalyzes the hydrogen peroxide so that thehumidity sensor measures only water vapor. The measured relative humidityindicates the humidity of the air caused only by water vapor. When measuring H2O2 in a vapor state, relativesaturation is the parameter that indicates the amount of humidity in the aircaused by both hydrogen peroxide and water vapor. The air mixture startsto condense when the relative saturation reaches100 %RS. Relative saturation isthe only parameter that indicates when the air mixture with the water vapor andhydrogen peroxide vapor starts to condense. Therefore, it is essential tofollow the relative saturation value during the bio-decontamination process.
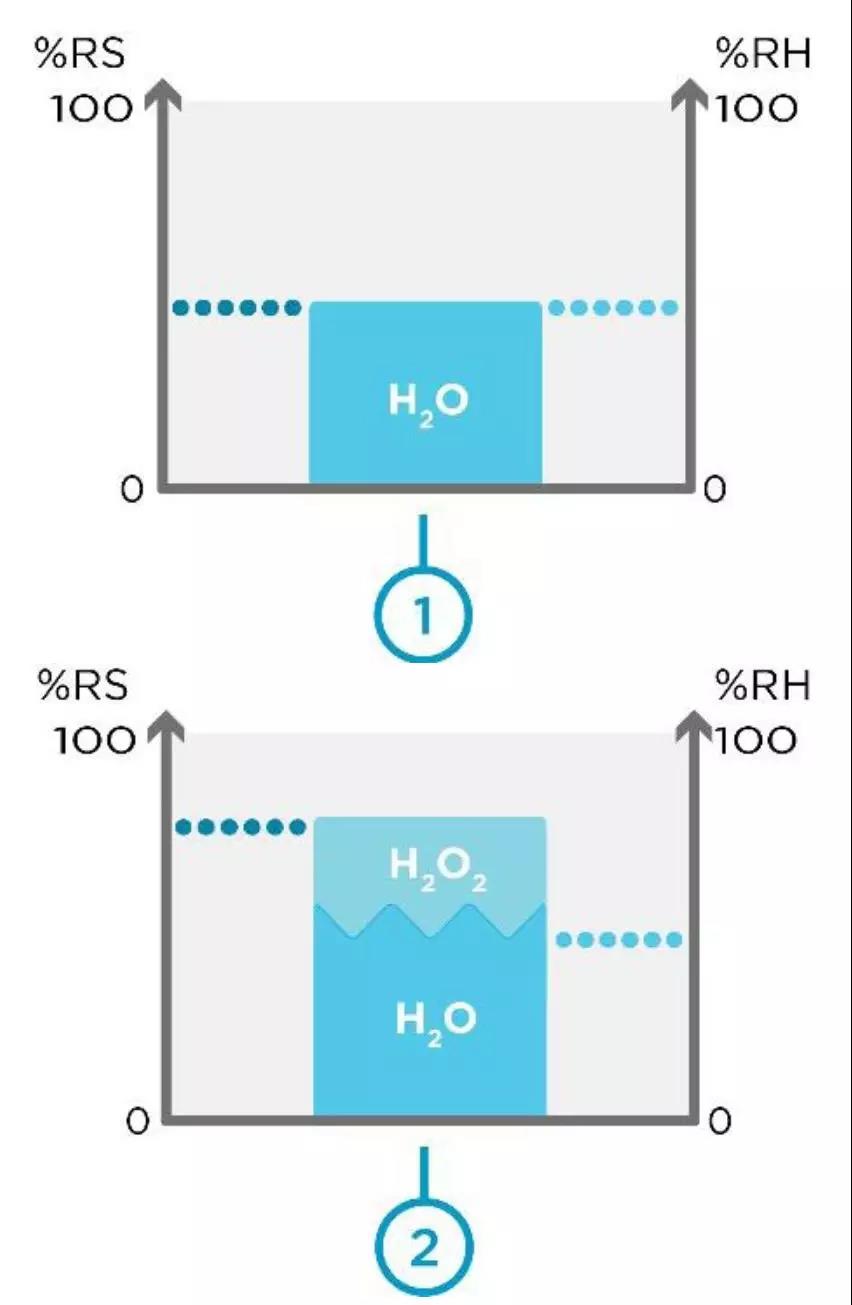
Figure 1. Space 1 without H2O2 vapor and space 2 with H2O2 Vapor.
Figure 1 above shows you twodifferent spaces: Space 1 withoutH2O2 vapor and space 2 with H2O2 vapor. When H2O2 vapor is not present, relativesaturation equals relative humidity. This can be seen in space 1. Within space2, we have the same volume of air with H2O2 vapor introduced. Now, relativesaturation is higher than relative humidity.
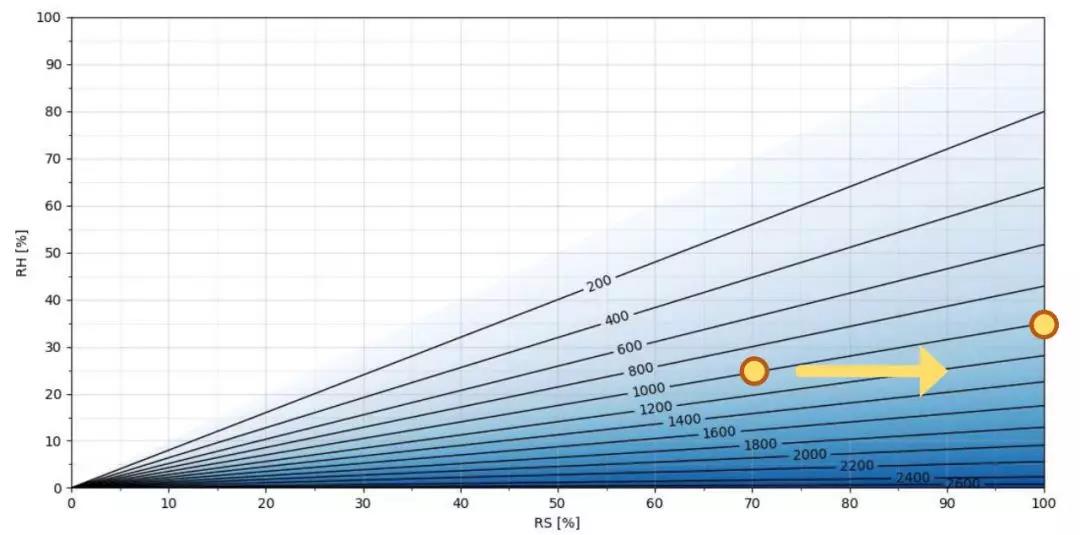
Figure 2. H2O2 ppm as a function of RS/RH at T = 25 °C
Figure 2 shows you H2O2ppm asa function of relative saturationand relative humidity at 25 °C. Relative saturation is on the x axis andrelative humidity is on the y axis. Darker shading shows higher ppm of H2O2. As you can see, the morehydrogen peroxide in the air mixture, the greater the difference betweenrelative saturation and relative humidity values. For example, at 25 °C and1000 ppm hydrogen peroxide, the humidity level 25%RH is equivalent to 70%RS.When this gas mixture with 1000 ppm hydrogen peroxide starts to condense(relativesaturation being 100%), relativehumidityis 35%.
Temperature affects how muchhydrogen peroxide can be in the air before condensation (relative saturationequals 100 %RS). Thus, the graph on Figure 2 changes when temperature changes.
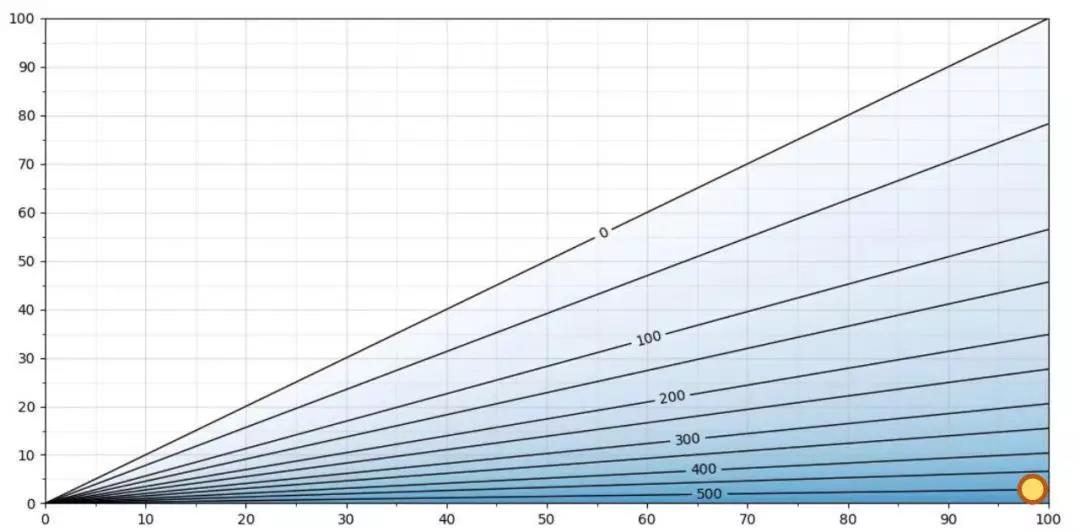
Figure 3. H2O2 ppm as a function of RS/RH at T = 5 °C
图3 5℃下H2O2浓度与相对饱和度/相对湿度的关系
Figure 3 showssame graph at5 °C. The maximum H2O2ppm level at 5 °C is slightly above 500 ppm. As an example, at 5 °C,500ppm hydrogen peroxide and Relative Saturation 100 %RS, the relative humidity isapproximately 2 %RH. As the relative saturation is 100 %RS, the air mixturewill condense. The difference between %RS and %RH at this temperature isenormous: 100 %RS vs. 2 %RH. Measuring %RH in this particular case is of noreal value.
The higher the temperature, themore H2O2 ppm can be added to the airmixture before condensation, as seen in Figures 4 and 5. In Figure4, at a temperature of 50 degreesCelsius, an H2O2 concentration of >12000 ppmcan be achieved.
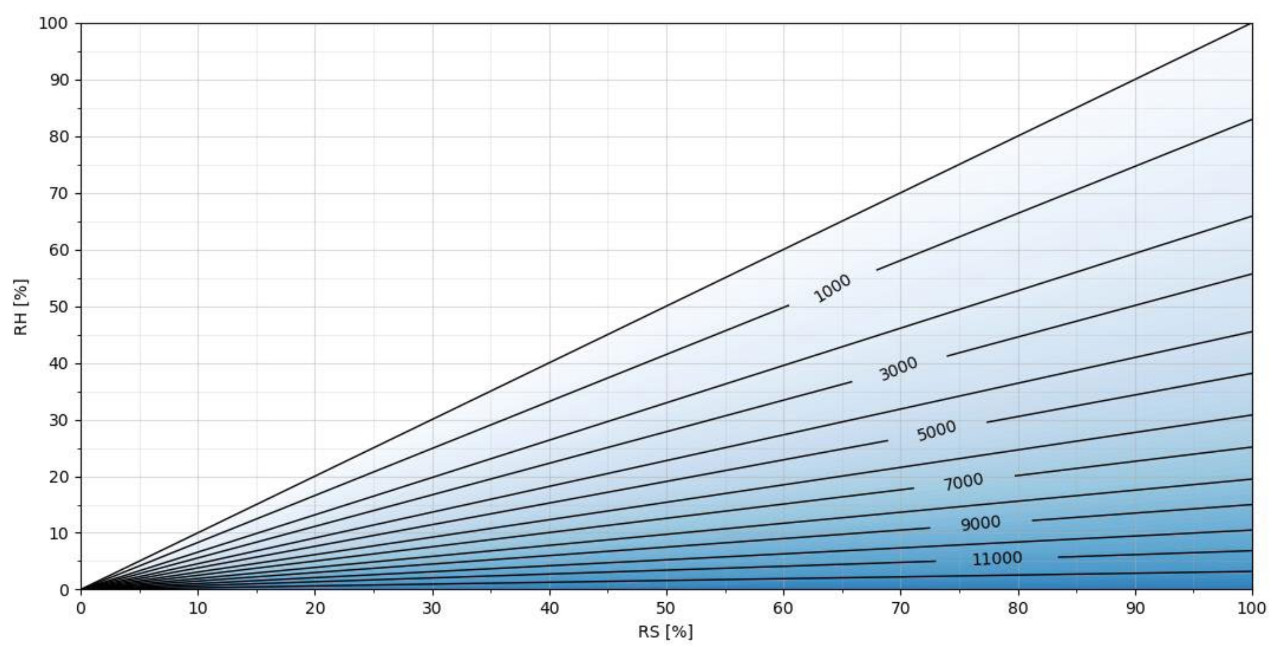
Figure 4. H2O2 ppm as a function of RS/RH at T = 50 °C
Each point in Figure 5 represents a condensation point,I.E. relative saturation is 100 %RS. Temperature is on the x axis and H2O2 ppm is on the y axis. The curvesshow the maximum relative humidity. As an example, at 20 °C and 300 ppmhydrogen peroxide, 60%RH is equivalent to 100%RS. If we increase airtemperature to40°C with an H2O2 concentration at 300 ppm, relative humidity will be 87% andrelative saturation will be 100%. Condensation occurs at a relative humidity of<100% because of the relationship between air temperature and H2O2 concentration. Therefore thehigher the temperature, the higher the maximum RH%. If we increase the hydrogenperoxide level from300ppm to 900 ppm at 40 °C, then themaximum achievable relative humidity decreases from87%RHto 70 %RH. The higher the ppm concentration, the lower the maximum %RH.
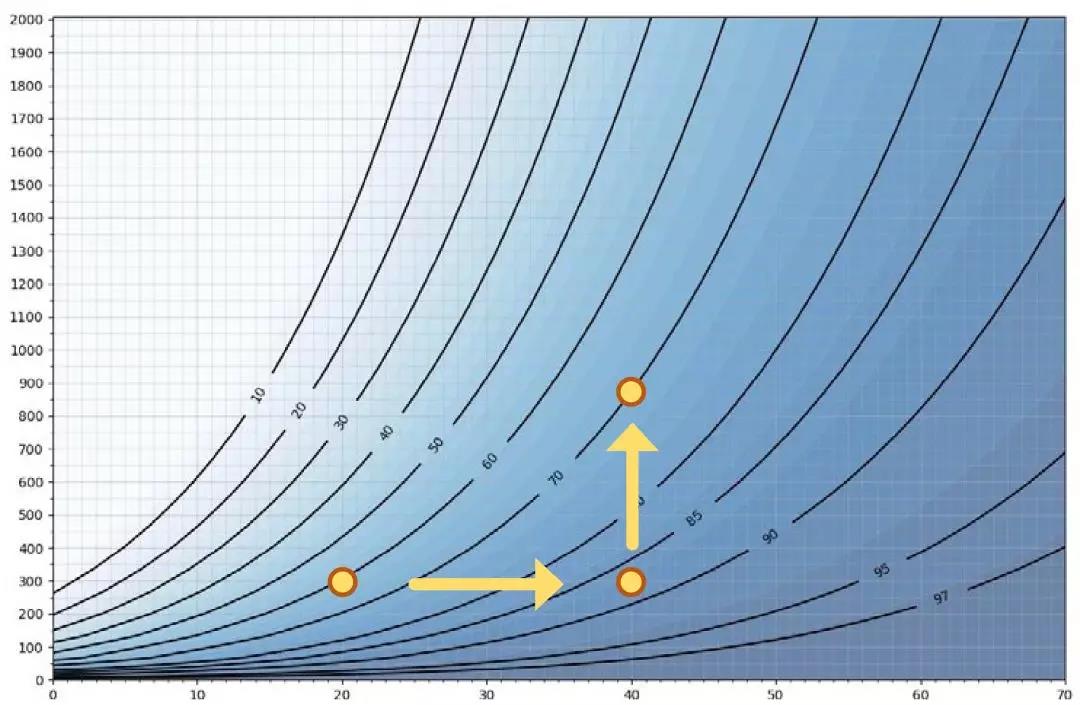
Figure 5. The x axis = temperature, y axis = ppmconcentration.
Maximum achievable Relative Humidity (RS = 100 %RS)
These figures illustrate why it isinsufficient to look only at relative humidity in bio-decontamination processesthat use vaporized hydrogen peroxide. Air that is infused with H2O2 will condense at <100%relative humidity, depending on the temperature of the air and theconcentration of hydrogen peroxide. When the air mixture contains vaporized H2O2, relative humidity can neverreach 100% making it nearly impossible to accurately estimate when condensationwill occur. The greater the temperature, the greater the allowable relativehumidity. On the other hand, the higher the H2O2 concentration, the lower ismaximum achievable RH.
When performing bio-decontamination with vaporized hydrogenperoxide, relative saturation is the only parameter that accurately representsthe true saturation level; that is, the point at which you can expectcondensation to occur.